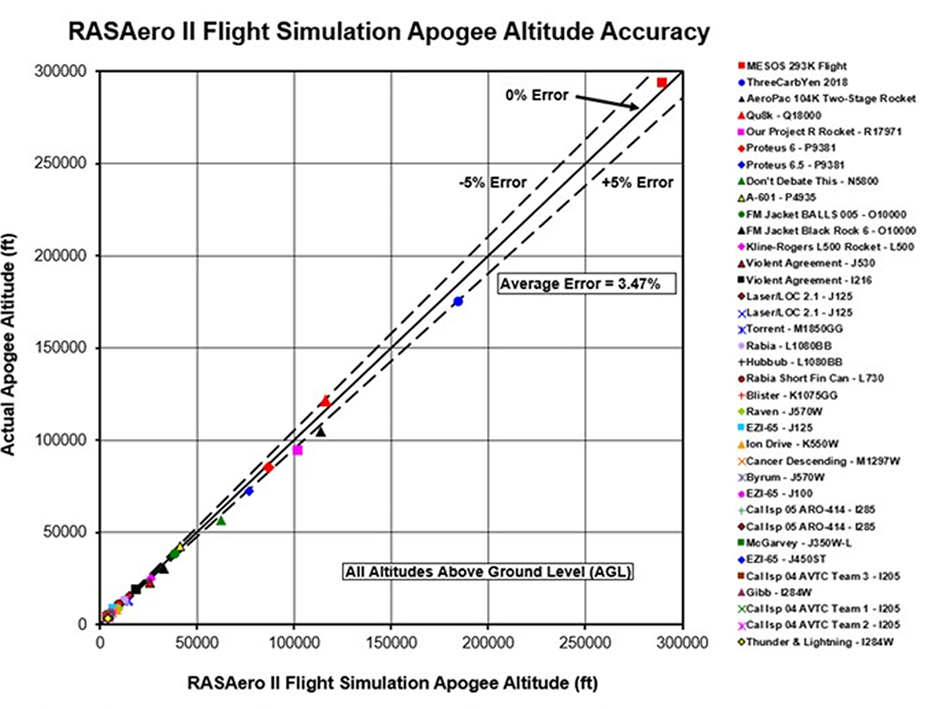
The accuracy of the RASAero II flight simulation for high power rockets and amateur rockets is shown in the Plot and Table below, where the RASAero II flight simulation apogee altitude is compared with barometric altimeter data, optical tracking data, accelerometer-based flight data, and GPS flight data for a representative set of high power rockets and amateur rockets. RASAero II rocket files (.CDX1 files) for most of these rockets are included in the RASAero II software download.
All altitudes are Above Ground Level (AGL).| Rocket | Motor(s) | Diameter (in) | Flight Data | Apogee Altitude (ft) | RASAero Flight Sim Apogee Altitude (ft) |
Percent Error |
||||||||
| MESOS 293K ft Flight | O4374 (KIP-EX) M787 (KIP-EX) |
Booster = 4.68 Sustainer = 3.15 |
GPS (See Note 1) |
293488 | 289789 | -1.26% | ||||||||
| ThreeCarbYen 2018 | N5800 (CTI) N1560 (CTI) M1401 (CTI) |
Stage-1 = 4.28 Stage-2 = 4.1 Stage-3 = 3.17 |
GPS (See Note 2) |
175000 | 185018 | 5.72% | ||||||||
| AeroPac 104K ft Two- Stage Rocket |
N1048 (AT) M685W (AT) |
Booster = 4.05 Sustainer = 3.08 |
GPS (See Note 3) |
104659 | 113786 | 8.72% | ||||||||
| Qu8k | Q18000 (Deville-EX) | 8.000 | Integrated Accelerometer Data (See Note 4) |
121478 | 116254 | -4.30% | ||||||||
| Our Project R Rocket | R17971 | 10.500 | Time to Apogee from Onboard Video (See Note 5) |
94000 | 102402 | 8.94% | ||||||||
| Proteus 6 | P9381 (Loki-EX) | 6.000 | Integrated Accelerometer Data (See Note 6) |
85067 | 86799 | 2.04% | ||||||||
| Proteus 6.5 | P9381 (Loki-EX) | 6.000 | Average of GPS and Integrated Accelerometer Data | 72233 | 76639 | 6.10% | ||||||||
| Don't Debate This | N5800 (CTI) | 3.9173 | Barometric Altimeter (See Note 7) |
56573 | 62308 | 10.14% | ||||||||
| A-601 | P4935 | 6.125 | GPS (See Note 8) |
42771 | 41086 | -3.94% | ||||||||
| Full Metal Jacket - BALLS 005 | O10000 (Kosdon) | 4.000 | Optical Track | 37981 | 38820 | 2.21% | ||||||||
| Full Metal Jacket - Black Rock-6 | O10000 (Kosdon) | 4.000 | Optical Track | 30038 | 32646 | 8.68% | ||||||||
| Kline-Rogers L500 Rocket | L500 (Ace) | 2.260 | Optical Track | 24771 | 26485 | 6.92% | ||||||||
| Violent Agreement SS Sustainer | J530 (CTI) | 1.600 | Barometric Altimeter (See Note 9) |
22874 | 25602 | 11.93% | ||||||||
| Violent Agreement | I216 (CTI) | 1.600 | Barometric Altimeter (See Note 9) |
18495 | 19256 | 4.11% | ||||||||
| Laser/LOC-2.1 | J125 | 2.260 | Optical Track | 15818 | 14868 | -6.01% | ||||||||
| Laser/LOC-2.1 | J125 | 2.260 | Optical Track | 13219 | 14616 | 10.57% | ||||||||
| Torrent | M1850GG (AMW) | 4.000 | Barometric Altimeter | 12807 | 13852 | 8.16% | ||||||||
| Rabia | L1080BB (AMW) | 3.000 | Barometric Altimeter | 12745 | 12777 | 0.25% | ||||||||
| Hubbub | L1080BB (AMW) | 4.024 | Barometric Altimeter | 10750 | 10883 | 1.24% | ||||||||
| Rabia - Short Fin Can | L730 (CTI) | 3.126 | Barometric Altimeter | 10584 | 10376 | -1.97% | ||||||||
| Blister | K1075GG (AMW) | 3.000 | Barometric Altimeter | 9026 | 8347 | -7.52% | ||||||||
| Raven | J570W (AT) | 1.750 | Barometric Altimeter | 8815 | 9288 | 5.37% | ||||||||
| EZI-65 J125 | J125 | 3.998 | Optical Track | 8068 | 7436 | -7.83% | ||||||||
| Ion Drive | K550W (AT) | 4.000 | Barometric Altimeter | 8027 | 8642 | 7.66% | ||||||||
| Cancer Descending | M1297W (AT) | 6.000 | Barometric Altimeter | 6188 | 6328 | 2.26% | ||||||||
| Byrum | J570W (AT) | 3.000 | Barometric Altimeter | 5732 | 5280 | -7.89% | ||||||||
| EZI-65 J100 | J100 | 3.998 | Optical Track | 5671 | 6472 | 14.12% | ||||||||
| Caliber Isp 05 ARO-414 | I285 (CTI) | 3.100 | Barometric Altimeter | 5085 | 4842 | -4.78% | ||||||||
| Caliber Isp 05 ARO-414 | I285 (CTI) | 3.100 | Barometric Altimeter | 4930 | 4831 | -2.01% | ||||||||
| McGarvey | J350W-L (AT) | 3.000 | Barometric Altimeter | 4246 | 4862 | 14.51% | ||||||||
| EZI-65 | J450ST (AMW) | 4.000 | Barometric Altimeter | 3965 | 4214 | 6.28% | ||||||||
| Caliber Isp 04 AVTC Team 3 | I205 (CTI) | 3.100 | Barometric Altimeter | 3964 | 3871 | -2.35% | ||||||||
| Gibb | I284W (AT) | 3.000 | Barometric Altimeter | 3913 | 4310 | 10.15% | ||||||||
| Caliber Isp 04 AVTC Team 1 | I205 (CTI) | 3.100 | Barometric Altimeter | 3837 | 3943 | 2.76% | ||||||||
| Caliber Isp 04 AVTC Team 2 | I205 (CTI) | 3.100 | Barometric Altimeter | 3710 | 3871 | 4.34% | ||||||||
| Thunder & Lightning | I284W (AT) | 3.100 | Barometric Altimeter | 3577 | 3989 | 11.52% | ||||||||
| Average Error = |
3.47% | |||||||||||||
| 80.6% of Flights Error < 10% |
||||||||||||||
| 41.7% of Flights Error < 5% |
||||||||||||||
|
Note 1: Altitude based on GPS data. Rocket carried a Kate onboard instrumentation unit. Accelerometer-based altitude and barometric altitude also obtained during the flight. Data from Kate Instrumentation Unit: All Altitudes are Above Ground Level (AGL) GPS Apogee Altitude = 293,488 ft Accelerometer-Based Altitude = 294,271 ft Barometric Altimeter Apogee Altitude = 275,131 ft GPS Downrange Distance at Apogee = 55,767 ft From Accelerometer data rocket reached 4,047 ft/sec (Mach 4.18) at 62,301 ft RASAero II Flt Sim Apogee Altitude is a postflight simulation where Sustainer (Stage-2) ignition delay time has been adjusted to match the flight data, and the launch angle from vertical has been adjusted to match the downrange distance at apogee. |
||||||||||||||
| Note 2: Altitude based on GPS data. Last GPS data point on ascent before predicted apogee was at 160,000 ft. Next GPS data point was received after predicted apogee during descent, and was just under 160,000 ft. From extrapolation of GPS altitude data with time estimated apogee altitude was 175,000 ft. | ||||||||||||||
| Note 3: Altitude based on GPS data. GPS Downrange Distance at Apogee = 17.1 miles (statute miles, US miles). RASAero II Flt Sim Apogee Altitude is a postflight simulation where the launch angle from vertical has been adjusted to match the downrange distance at apogee. | ||||||||||||||
| Note 4: Altitude based on integration of onboard accelerometer data. Altitude based on the average of the apogee altitude from the two onboard accelerometers. The rocket had a very vertical flight, and landed only 3 miles from the launch site. | ||||||||||||||
| Note 5: Altitude based on time to apogee from onboard video (Reference: Postflight Analysis of the OuR Project R Rocket Flight, High Power Rocketry magazine, July 1997). From onboard video rocket spin rate 0.26-0.37 revolutions/sec. RASAero II flight simulation based on 3.5 degree coning angle from onboard video. | ||||||||||||||
| Note 6: Altitude based on integration of onboard accelerometer data. Altitude based on the average of the apogee altitude from the two onboard accelerometers. Rocket also carried a barometric altimeter and a GPS unit. Data from barometric altimeter and GPS unit stopped above 46000 ft. Integrated accelerometer data agreed well with barometric altimeter data up to 46000 ft, barometric altimeter data agreed well with GPS data below 46000 ft during parachute descent. | ||||||||||||||
| Note 7: Altitude based on the average of the apogee altitude from Featherweight and PerfectFlite barometric altimeters. Featherweight barometric altimeter altitude was 56504 ft, PerfectFlite barometric altimeter altitude was 56641 ft. | ||||||||||||||
Note 8: Altitude based on GPS data. Rocket also carried two barometric altimeters and an accelerometer. Altitudes from the different onboard instrumentation were the following:
The rocket had a very vertical flight, and landed only 2 miles from the launch site. |
||||||||||||||
| Note 9: Altitude from barometric altimeter, with the altitude data adjusted based on balloon-referenced atmospheric pressure data, from a balloon launched prior to flight. | ||||||||||||||
|
As can be seen in the Plot and the Table above, for this representative set of high power rocket and amateur rocket barometric altimeter data, optical tracking data, accelerometer-based flight data, and GPS flight data, the average error in the RASAero II flight simulation apogee altitude was 3.47%, with 80.6% of the flights within +/-10%, and 41.7% of the flights within +/-5%. |
||||||||||||||